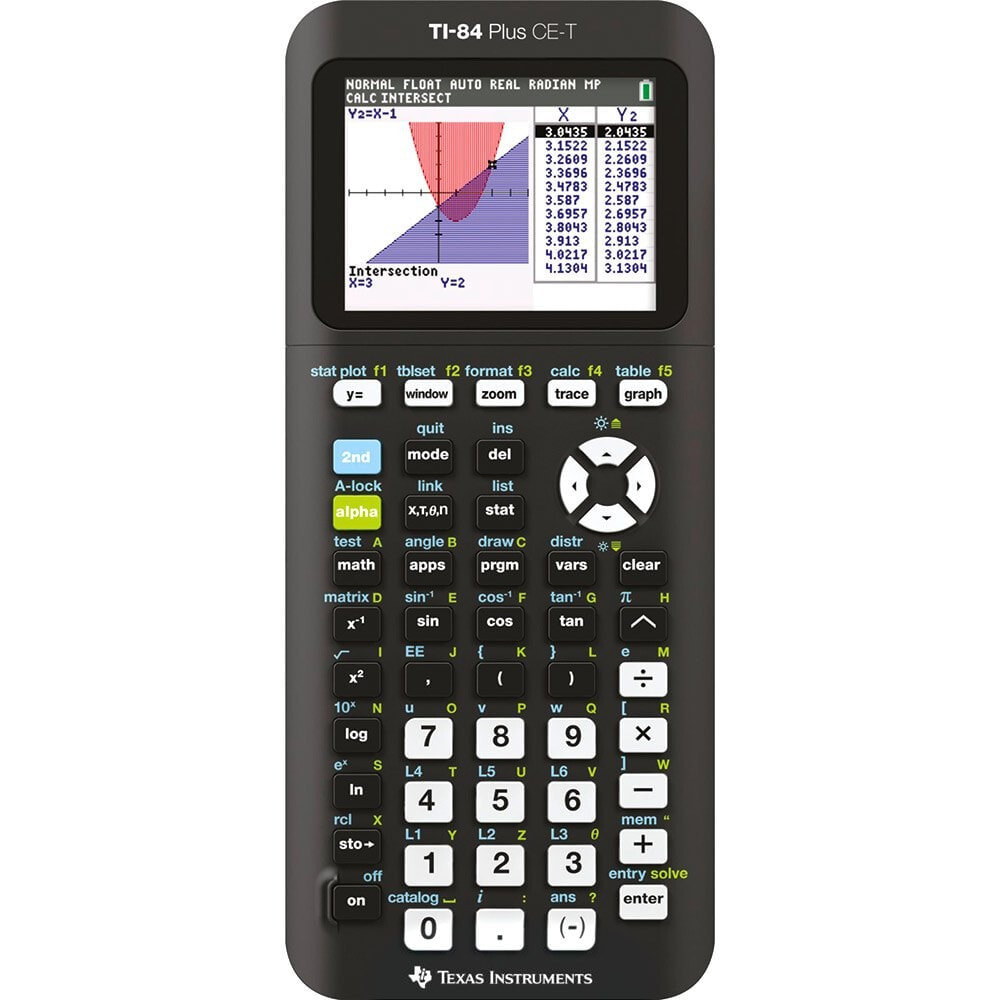
TEXAS INSTRUMENTS TI 84 Plus CE-T Phyton Edition Calculator
Бестселлер
- Артикул:
- 135879681


141 157 AMD
Характеристики
Дизайн
- Цвет
- Черный
Прочие свойства
- Бренд
- Texas Instruments
Описание
Professional graphing calculator: Texas Instruments TI 84 Plus CE-T.
Discover the TI-84 Plus: The TI-84 Plus CE-T graphing calculator is extremely light and handy.
- High-resolution, backlit color display.
- Integrated TI battery.
- Familiar TI-84 Plus functionality.
- Import and use images.
- Particularly light, therefore ideal for mobile use.
Brilliant colors. Optimal presentation.
- Visualize concepts and make direct connections between equations, data and graphs faster - all in color.
- Improved readability through high-resolution, backlit display.
- Gridlines also improve the readability of graphs.
- Color-coded equations, diagrams and objects can be used to distinguish between graphs and diagrams.
Hardware:
- Screen size: 320 x 240 pixels (2.8 diagonal).
- Screen resolution: 140 dpi, color depth 16 bit.
- Integrated TI battery.
- 3 MB FLASH ROM memory for data archiving and storage of apps.
- 154 KB of available RAM memory.
- USB port for connection to a computer or for connection to a TI-84 Plus, TI-84 Plus Silver Edition, TI-84 Plus C Silver Edition or TI-84 Plus CE-T graphing calculator.
- Robust protective cover.
- Internal clock with date and time display.
Connection options:
- Download the latest functions and applications (apps).
- TI connectivity cable included.
- The TI Connectivity Cable and the TI Connect software enable data to be transferred between the computer and computer, as well as print output and storage on a data carrier.
Integrated functions:
- Add images as diagram background.
- Function graphs in 15 colors.
- Change the format and color of the graph axes and grids.
- Syntax help.
- Alphabetical CATALOG of all TI calculator operations in one menu.
- Access to advanced functions via pull-down menus on the display.
- Real and complex numbers are calculated with 14-digit precision and displayed with 10 digits and a two-digit exponent.
- Graphically displays 10 rectangular functions, 6 parameter functions, 6 polar expressions and 3 recursively defined sequences.
- Up to 10 diagram functions can be defined, saved, displayed in the graph and analyzed at the same time.
- In sequence mode, graphs over time, cobweb / stairs graph and state graphs are displayed.
- Custom list names. Lists hold up to 999 items.
- 17 interactive zoom functions.
- Numerical evaluations in table format for all graphic modes.
- Interactive analysis of function values, roots, maxima, minima, integrals and derivatives.
- 8 different graph formats for individual presentations of all graphs.
- Optional horizontal and vertical screen division.
- Display graph and table side by side.
- Stores up to 10 matrices.
- Available matrix operations: reciprocal value, determinant, transpose, matrix expansion, staircase normal form and elementary line transformations. Convert matrix to list (and vice versa).
- List-based statistical analysis for one or two variables, including logistics, sine, median-median, linear, logarithm, exponential, power, quadratic, cubic and quartic regression models.
- 3 Definitions of statistical diagrams for scatter diagrams, line diagrams, histograms, box plots and modified box plots as well as normal distribution diagrams.
- Higher statistical functions including 10 statistical test functions, 7 confidence interval functions, and one-way analysis of variance.
- 15 probability distribution functions such as normal, student-t, chi-square, binomial and poisson.
- Financial math functions such as time value of money, cash flows, and amortization. Interactive full screen editor for solving time value problems.
- Interactive equation editor for numerical resolution according to different variables in an equation.
- 11 regression calculations
Applications:
- Cabri Jr. Geometry.
- CellSheet.
- Conic graphing.
- Inequality graphing.
- Polynomial Root Finder / Simultaneous Equation Solver.
- Probability simulation.
- Transformation graphing.
- Vernier EasyData.
- Danish translation.
- German translation.
- French translation.
- Dutch translation.
- Portuguese translation.
- Swedish translation.
- Spanish translation.